Well, a line of code is more meaningful than a thousand sentences. Here is the beef!
The MATLAB code:
%%%%%%%%%%%%%% begin test 1 %%%%%%%%%%%%%%%%%%
clear all;
clc
scale = 8192*8192;
A=zeros(1,scale);
for i=1:scale
A(i) = sin(i*2*pi/1024);
end
serial_time = toc
tic
parfor i=1:scale
A(i) = sin(i*2*pi/1024);
end
parallel_time = toc
%%%%%%%%%%%%%% END of test 1 %%%%%%%%%%%%%%%%%%%%%%%%%%%%%%%% BEGIN of test 2 %%%%%%%%%%%%%%%
clear all;
scale2 = 10;
a= zeros(scale2);
tic
for k = 1:scale2
a(k) = max(eig(rand(300)));
end
serial_time2 = toc
matlabpool openlocal2
tic
parfor k = 1:scale2
a(k) = max(eig(rand(300)));
end
parallel_time2 = toc
matlabpool close%%%%%%%%%%%%%% END of test 2 %%%%%%%%%%%%%%%
The timing result:
serial_time =

    0.0048


parallel_time =

    0.2451


serial_time2 =

    3.8324

Starting matlabpool using the 'local' configuration ... connected to 2 labs.

parallel_time2 =

    2.5019

Sending a stop signal to all the labs ... stopped.
Therefore, using parfor does not guarantee speed up all the time.
I am studying MATLAB Parallel Computing Toolbox these days. Then I notice an interesting thing. It seems MATLAB can use two cores automatically without the need for me to turn on parallel features, e.g., parfor.
Here is a simple code
clear all;
scale2 = 120;
a= zeros(scale2);
tic
for k = 1:scale2
a(k) = max(eig(rand(300)));
end
serial_time2 = toc
matlabpool openlocal2
tic
parfor k = 1:scale2
a(k) = max(eig(rand(300)));
end
parallel_time2 = toc
matlabpool close
The first part uses regular for loop while the second part uses the parallel for loop (parfor). I have only two cores. So I only open two local labs.
But the information from "top" is funny. When the regular for loop runs, both cores are working, like this:
serial_time2 =

   31.9760

Starting matlabpool using the 'local' configuration ... connected to 2 labs.

parallel_time2 =

   18.2054

Sending a stop signal to all the labs ... stopped.
So, MATLAB seems to try to use two cores even when parallel codings are not used on UNIX machines. But it does not "fully" use two cores though two cores are both working 100% in regular for loops. I guess this has to do with the communication overhead.
I just saw an interesting feature of MATLAB today. It's called Profiler in Parallel Computing Toolbox (http://www.mathworks.com/help/toolbox/distcomp/bra51qt-1.html). Basically, it's very similar to profile command (http://www.mathworks.com/help/techdoc/ref/profile.html).
You can know the time spending on each line of code. This is a very useful tool for scientific computing. I would like to know whether we have the similar stuff for Python.
I was configuring the firefall to allow my colleagues get thru. But I saw an suspicious connection to a sub-sub-sub-sub domain of Softlayer.com What the heck!
Then I saw it was Dropbox doing that. Geez! Does this mean that Dropbox is using the cloud provided by Softlayer.com ?
Around a month ago, I met an engineer from an EEG sampling system company. I asked him many specifications of their circuit. He told me that they only amplify the EEG signal by 20 or 30 times and then feed it to a 24-bit ADC. Besides noise issues, did not understand why they chose high-resolution ADC over high-gain amplifier. Today I learned a lesson and figured out.
I am using NI myDAQ these days to test the amplification (very high gain, expected to be 10,000 or 80dB) circuit I prepared for ECG data acquisition project. Of course, Bode plot is what I used to the check the gain and phase shift.
My configuration. The chip on the left is an TI OPA177 used to divide the input voltage of INA128 to as low as 1mV. The minimum resolution of the Function Generator of NI myDAQ is 10mV and I wanted the signal amplitude to be as low as raw ECG. The chip on the right is TI INA128, with R_G set as 5 Ohm. The output signal of INA128 is filtered by an RC bandpass filter and then goes to myDAQ. There was an error in the circuit when I shot this picture. The ground of RC circuit was not grounded.
Any analog circuit has a setting time (at least the speed of light), e.g., to reach a feedback balance. When the gain of an amplifier goes very high, the setting time increases nonlinearly. According to the datasheet (http://www.ti.com/lit/gpn/ina128) from Texas Instruments, the setting time of instrumentation amplifier INA128 is 9 us when gain is 100 while 80 us when gain is 1000. The gain of INA128 ranges from 1 to 10000. But the datasheet does not say what will happen for gain larger than 1000. Why? Probably because the setting time is very long and varies from device to device.
This is like many bivariate constraints in analog circuit design, e.g., gain-bandwidth product. Therefore, in Bode analysis, it needs to wait significant long enough time before you can measure the output and move the next frequency.
But the Bode Analyzer that comes with NI myDAQ (also used on NI ElVIS II/II+), does not give the circuit enough setting time. The software measures the output before the circuit can settle down from the input stimulus.
What happened was, when gain is 1000, I saw this
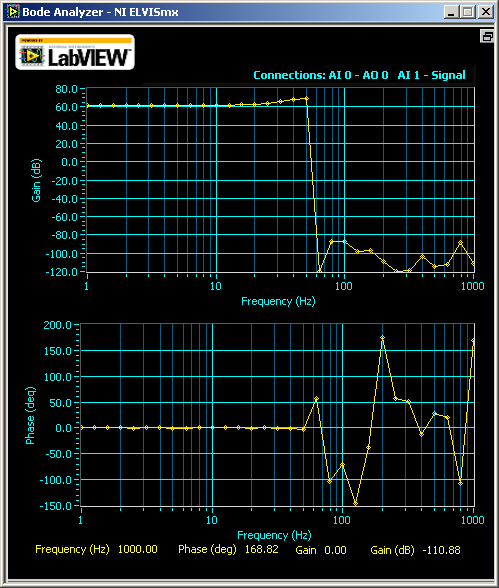
I said, what? Where are my signals over 14 Hz? But when I increase the gain to 5000 (well, from myDAQ's oscilloscope which now I assume has errors too because the theoretical gain for my configuration is 10,000.), I was thinking to withdraw this class:
The gain was constantly high before 10 Hz and dropped drastically after that. The phase shifting plot looked like stock market after that. According to the datasheet of INA128, the gain should not drop before 1kHz.
Why? Now I know the answer, because the Bode Analyzer did not wait until the circuit to stabilize. It measured unstable output. As the gain goes higher, more waiting time is needed.
But at that moment, I did not think about this. I tried another way to study the problem, using other instruments. I checked the waveform on the Oscilloscope of NI myDAQ while letting the Function Generator of myDAQ sweep from 1 Hz to 20Hz, with a step of 0.5 Hz. And, I let the signal stay at each frequency for 3 second, way enough for the circuit to stabilize. By comparing the Vp-p on the oscilloscope, I saw that my circuit wasn't as bad as the Bode plot showed. It was as designed.
Below is a video I took when the Function Generator swept. I didn't save the original video for the output from INA128. Instead, I recorded the output waveform from an RC bandpass filter following the output of INA128 (blue line). The green line was the input to INA128. I set the cutoff frequency of the RC filter at 15Hz (which is not exact because the discrete components have 5% error each). As you can see, the signal drops gradually after 8Hz but not at a >100dB attenuation. Also, the phase shift wasn't as crazy as stock market. The shift was almost invisible. Of course, I need to fix the circuit because apparently, the -3-dB point was at 22Hz (not shown on the screen as I ended the screencast early).
So, go back to my question, why medical instruments prefer high-resolution ADC over high-gain amplifier, besides noise issues. Well, a high-gain amplifier takes long time to stabilize (INA128 takes 80us to set at G=1000), then the sampling rate cannot be high (for INA128, sampling rate can not be higher than 10kHz when G=1000). The setting time for amplifiers at high gain, is longer than the setting time of a high-resolution ADC (which can handle MHz signal).
PS: Another interesting thing is that Bode Analyzer of myDAQ gave me this for TI INA101:
I would like to know whether INA101 is really bad from 1 to 10 Hz or it's another problem of the Bode Analyzer of myDAQ.
Once I felt that Mac OS X had no big difference from Linux. Geez, I was almost killed these weekend. A short version: Fink is way complex to use than Aptitude (like the apt-get on Ubuntu Linux, uhn? ).
Long version - hope i will help other AFNI users on 64-bit Mac OS X 10.6 Snow Leopard.
I thought I had AFNI already on my Mac. So I tried to study a function of it. I typed afni on the shell and this was my greetings:
$ afni
dyld: Library not loaded: /sw/lib/libpng12.0.dylib
  Referenced from: /Users/forrest/sw/abin/afni
  Reason: no suitable image found.  Did find:
    /sw/lib/libpng12.0.dylib: mach-o, but wrong architecture
Trace/BPT trap
I said again, what? How come Fink compiled everything as 32-bit?
Then I googled around religiously. I was the only unlucky guy. Many AFNI users had this problem.
The Fink I installed was 32-bit so everything installed via Fink was 32-bit. Why couldn't Fink select the version automatically when I installed it? I am lazy guy who never take a look at on screen prompts but press Enter all the time. Sadly, the default setting was 32-bit. I guess the reason is because Fink does not have as many 64-bit packages as 32-bit packages. But this shouldn't be a problem for open source software. Well, probably compiling existing 32-bit code on 64-bit Mac OS X is a little tricky. See, this problem does not exist on Linux because everything open.
Anywho (a lot people in west Texas do not understand this west Texas English word, meaning "anyway."), easiest solution: Remove everything under /sw and install everything from the scratch. So, I will go home now and leave the computer on.
Detailed fixings:
If you downloaded AFNI for Mac OS X 10.6 on 64-bit Intel Mac, you HAVE TO install 64-bit Fink.
Go to Fink's SourceForge page to download latest Fink source code.
Another thing I do not understand is that why my SelfUpdateTrees in /sw/etc/Fink.conf was set as 10.4 while the Distribution is 10.6. I don't know the meaning of SelfUpdateTrees anyway. So, I just pretend that there is no problem.
LaTeX is always a cool tool for technical writing. And change tracking in LaTeX is awesome - you can get professional track changing output in PDF. No need to bother with bubbles in Microsoft Word. (I really don't understand why Microsoft Word tracks changes on formatting (e.g., from bold to italic). If the document is professional, then that should be a mistake fixing rather than a change because a professional document has formatting standards.)
http://www.ctan.org/tex-archive/support/latexdiff/latexdiff It generates a version highlighting insertions and deleting using different colors, fonts or underlines from two LaTeX files. This one also supports put all deletions into footnotes. I would recommend this one over TrackChanges. On Ubuntu (10.04 or later), apt-get can install for you. If you just download and use on previous version of Ubuntu, you need to install Perl Algorithm::Diff package.
LyX: LyX is a LaTeX based WYSIWYG editor. It has GUI for tracking changes. The output can be in seen in final PDF. You can also use the GUI to accept or reject changes. I like this tool. Users don't need too much information about LaTeX. And a lotta people like GUIs.
I strongly dislike reading emails or papers in bureaucratic English, i.e., English of verbose structures of void words.
For example, please do not say "I've made the decision." I prefer "I've decided."
Bureaucratic sentences take me more time to read and long structures distract me. Longer emails or papers will also consume more natural resources in both soft and hard copies. I prefer to Go Green.
Geroge Orwell pointed out this problem in 1946 in his essay "Politics and the English language." You can Google to read this essay. For example, "contact" is better than "make contact with". Why would you use 3 words whereas 1 word is equivalent?
Besides this, I dislike another way to "prolong" sentences. Please do not say "I have modified some places on the basis of 2nd version. " I prefer to say "I have revised the 2nd version." - Actually, you don't wanna express whether the changes are major or minor.
This problem is very particular in British English. I prefer papers written by international (not English language native) authors. Their sentences are very compact, without rhetoric or stylish stuffs.
Chinese used in mainland China also have this problem. Communism propaganda machine has brainwashed people's way of critical thinking and speaking Chinese. Government official news are super long, full of bureaucratic and void words. They have also created many phrases that do not follow any Chinese grammar. A whole paragraph of their articles can express the same and tiny idea - like non-coding segments in a genome. One reason they do so may be to distract people in understanding their ideas and therefore prevent people from thinking the logic in their nonsense. Taiwanese or Singaporean gov docs are more concise and shorter.
So, bureaucratic sentences are very British or Communism, thus, unAmerican. Go green, and please say concise sentences.
Then, mount the installation DVD. Since LabVIEW 2009, NI puts Linux version and Mac OS X version on the same DVD - Did they copy the idea from MATLAB? So it's a little bit tricky: http://ubuntuforums.org/showthread.php?t=1223545
I used this command. But it varies depending on your CDROM device name.
sudo mount /dev/sr0 /media/cdrom1 -t hfsplus
Now you are ready. Go to the directory where LabVIEW installation RPMs are. Run these commands sequencially. You can copy and paste them into your Terminal.


